
This tutorial tries to explain what are the different steps to follow to implement a series of image processing functions in a dataset.
We will: * Create a dataset. * Find different motor positions and reshape the data into these dimensions. * Apply different image processing techniques like background substraction and hot pixel removal. * Apply a region of interest to the images to decrease CPU time and memory RAM. * Find and apply a linear shift between the images. * Find the different components that create the dataset by the means of blind source separation algorithms. * Link the components between different dataset with feature matching algorithms.
All operations are interchangeable, which means they can be applied in different orders, but it is important to apply the region of interest as soon as possible to decrease the computational time, especially in large datasets.
[1]:
from matplotlib import pyplot as plt
[2]:
def plot_comparison(original, filtered, filter_name, original_name="original"):
    fig, (ax1, ax2) = plt.subplots(ncols=2, figsize=(15, 15), sharex=True, sharey=True)
    ax1.imshow(original, cmap=plt.cm.viridis)
    ax1.set_title(original_name)
    ax2.imshow(filtered, cmap=plt.cm.viridis)
    ax2.set_title(filter_name)
Dataset#
[3]:
import glob
import os
import numpy
from darfix.core.dataset import Dataset

dataset = Dataset(
    _dir="/tmp/darfix",
    first_filename="/users/garrigaf/Documents/datasets/reduced_strain/strain_0000.edf",
    in_memory=True,
)
[4]:
from darfix.core.dimension import POSITIONER_METADATA

dataset.find_dimensions(POSITIONER_METADATA)
[5]:
dataset.remove_dim(1)
dataset.remove_dim(2)
dataset.add_dim(1, dataset.dims.get(3))
dataset.remove_dim(3)
[6]:
dataset.dims.get(0).set_unique_values(dataset.dims.get(0).unique_values)
[7]:
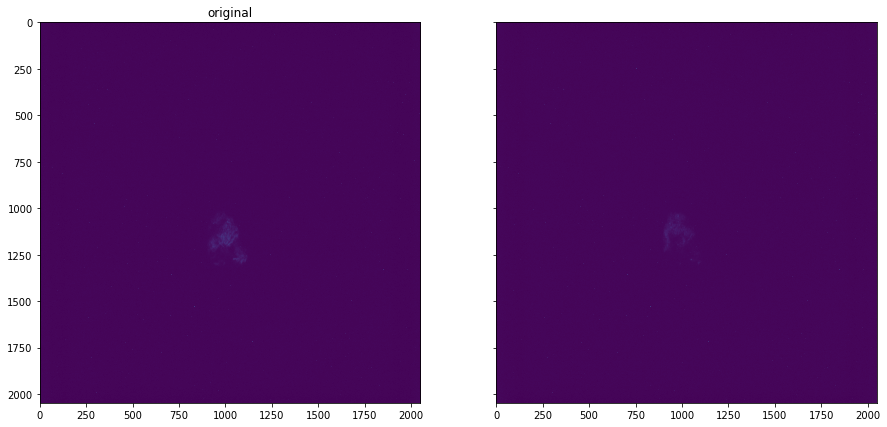
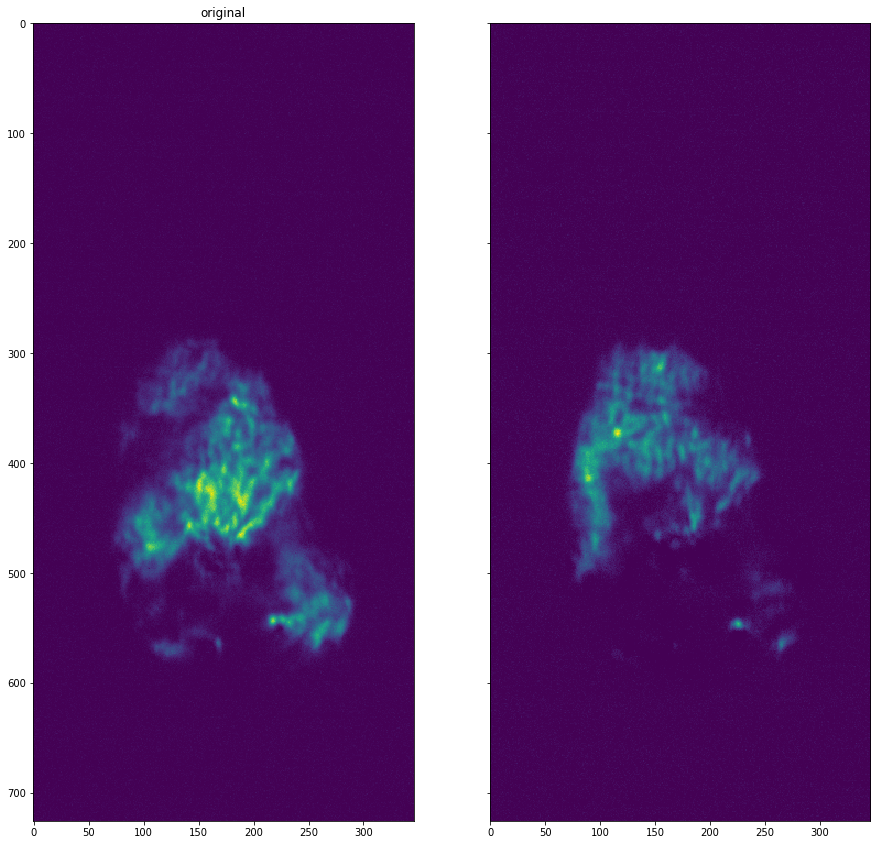
plot_comparison(dataset.get_data(13), dataset.get_data(16), "")
[8]:
dataset = dataset.reshape_data()
[9]:
metadata = numpy.swapaxes(dataset.data.metadata, 0, 1)[:, 0].shape
[10]:
dataset2 = dataset.project_data(1)
[11]:
dataset2.data.metadata.shape
[11]:
(2,)
ROI#
[12]:
from darfix.core import roi

roi_dataset = dataset.apply_roi(origin=[730, 825], size=[726, 346])
# bg_dataset = bg_dataset.apply_roi(origin=[900, 750], size=[500, 500])
[13]:
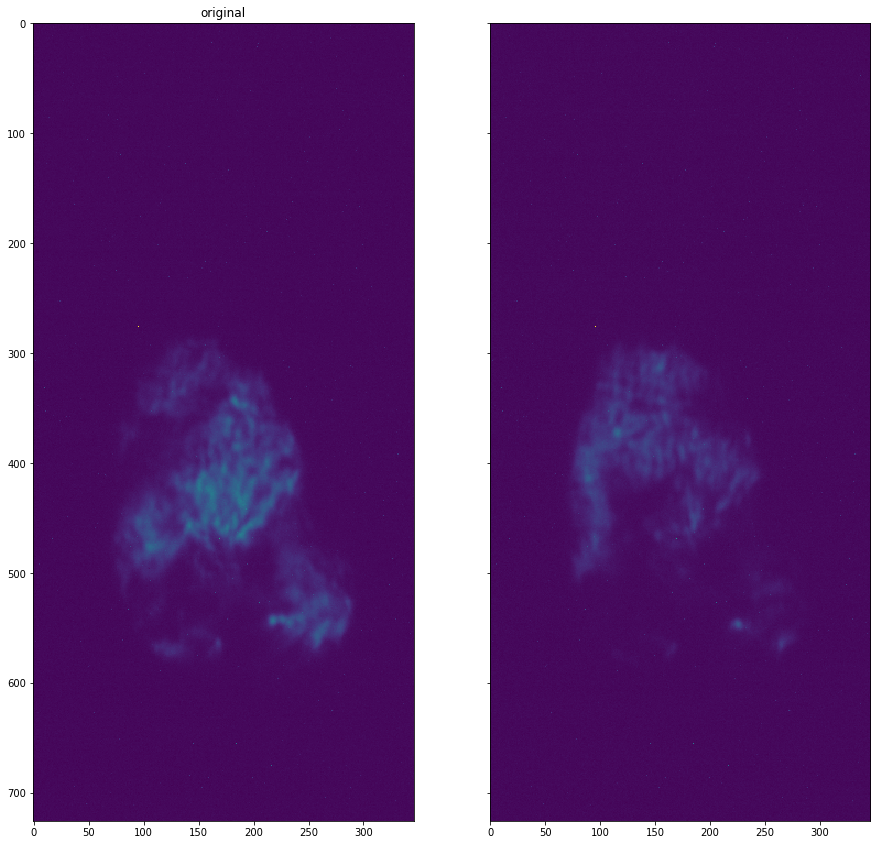
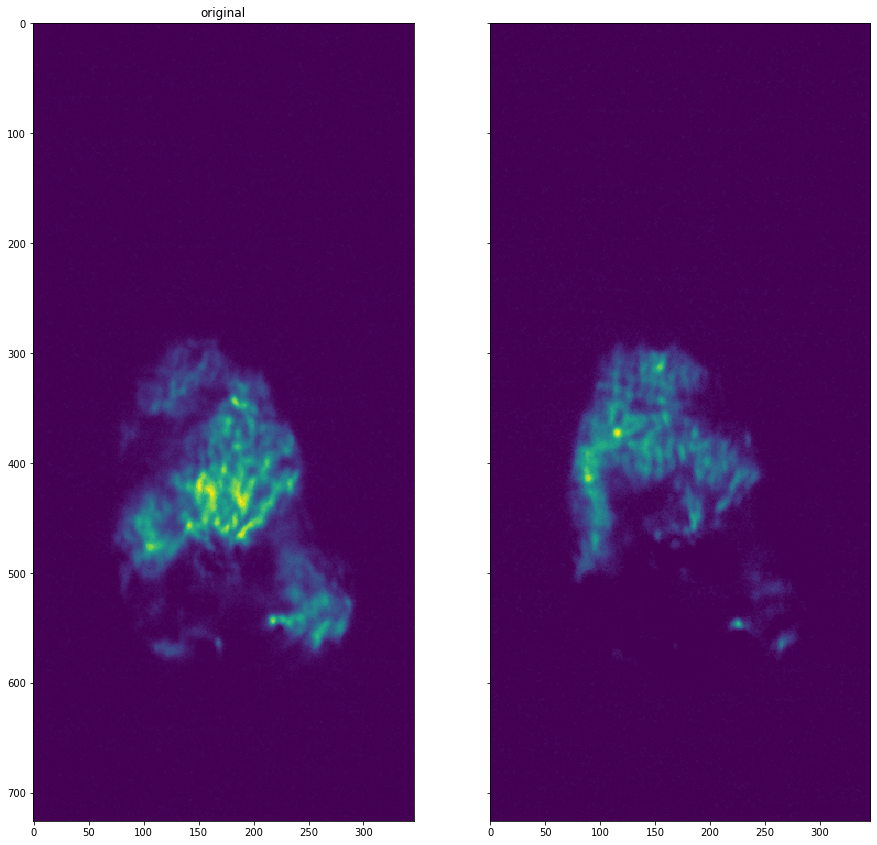
plot_comparison(roi_dataset.get_data(13), roi_dataset.get_data(16), "")
[14]:
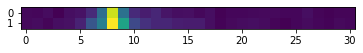
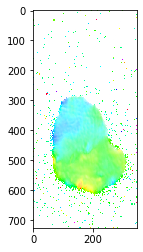
ydata = roi_dataset.data[:, :, 515, 181]
plt.imshow(ydata)
[14]:
<matplotlib.image.AxesImage at 0x7fd3e48d88d0>
[32]:
from darfix.core.mapping import fit_2d_rocking_curve

xdim = dataset.dims.get(1)
ydim = dataset.dims.get(0)
y_gauss = fit_2d_rocking_curve([ydata, None], [xdim.unique_values, ydim.unique_values])
[33]:
def multi_gaussian(M, x0, y0, xalpha, yalpha, A, C):
    x, y = M
    return A * numpy.exp(
        -(((x - x0) / xalpha) ** 2) - ((y - y0) / yalpha) ** 2 + C * (x - x0) * (y - y0)
    )
[34]:
from scipy.stats import multivariate_normal

xdim = dataset.dims.get(1)
ydim = dataset.dims.get(0)
X, Y = numpy.meshgrid(xdim.unique_values, ydim.unique_values)
xdata = numpy.vstack((X.ravel(), Y.ravel()))
print(xdata.shape)
(2, 961)
[38]:
from scipy.optimize import curve_fit

A = numpy.ptp(ydata)
x0 = numpy.mean(xdim.unique_values)
y0 = numpy.mean(ydim.unique_values)
xalpha = numpy.std(xdim.unique_values)
yalpha = numpy.std(ydim.unique_values)
C = 0
pars, cov = curve_fit(
    f=multi_gaussian,
    xdata=xdata,
    ydata=ydata.ravel(),
    p0=[x0, y0, xalpha, yalpha, A, C],
)
print(pars)
y_gauss = multi_gaussian(xdata, *pars)
---------------------------------------------------------------------------
RuntimeError                              Traceback (most recent call last)
<ipython-input-38-d2479a827da7> in <module>
      6 yalpha = numpy.std(ydim.unique_values)
      7 C = 0
----> 8 pars, cov = curve_fit(f=multi_gaussian, xdata=xdata, ydata=ydata.ravel(), p0=[x0, y0, xalpha, yalpha, A, C])
      9 print(pars)
     10 y_gauss = multi_gaussian(xdata, *pars)

~/.local/share/virtualenvs/darfix/lib/python3.7/site-packages/scipy/optimize/minpack.py in curve_fit(f, xdata, ydata, p0, sigma, absolute_sigma, check_finite, bounds, method, jac, **kwargs)
    792         cost = np.sum(infodict['fvec'] ** 2)
    793         if ier not in [1, 2, 3, 4]:
--> 794             raise RuntimeError("Optimal parameters not found: " + errmsg)
    795     else:
    796         # Rename maxfev (leastsq) to max_nfev (least_squares), if specified.

RuntimeError: Optimal parameters not found: Number of calls to function has reached maxfev = 1400.
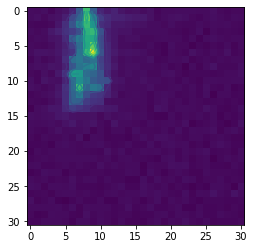
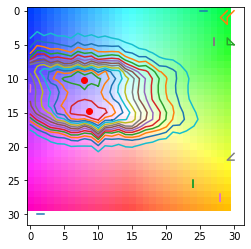
[37]:
plt.imshow(ydata)
plt.contour(y_gauss.reshape(ydata.shape))
plt.show()
Filter data#
[11]:
hi_indices, li_indices = dataset.partition_by_intensity()
Computing intensity |████████████████████████████████████████████████████████████████████████████████████████████████████| 100.0%
[12]:
li_indices.shape
[12]:
(397,)
Background subtraction#
[19]:
dataset = roi_dataset.apply_background_subtraction(method="median")
[20]:
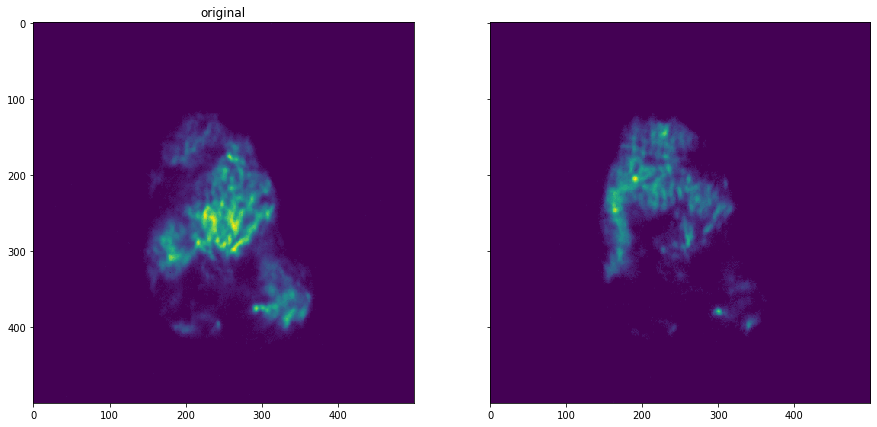
plot_comparison(dataset.get_data(13), dataset.get_data(16), "")
Hot Pixel Removal#
[21]:
dataset = dataset.apply_hot_pixel_removal()
[22]:
plot_comparison(dataset.get_data(13), dataset.get_data(16), "")
Threshold removal#
[23]:
dataset = dataset.apply_threshold_removal(bottom=10)
[24]:
plot_comparison(dataset.get_data(13), dataset.get_data(16), "")

Shift Detection#
[19]:
shift_dataset = dataset.find_and_apply_shift()
Finding shift |████████████████████████████████████████████████████████████████████████████████████████████████████| 100.0%
Applying shift |████████████████████████████████████████████████████████████████████████████████████████████████████| 100.0%
[20]:
plot_comparison(shift_dataset.get_data(13), shift_dataset.get_data(16), "")
[21]:
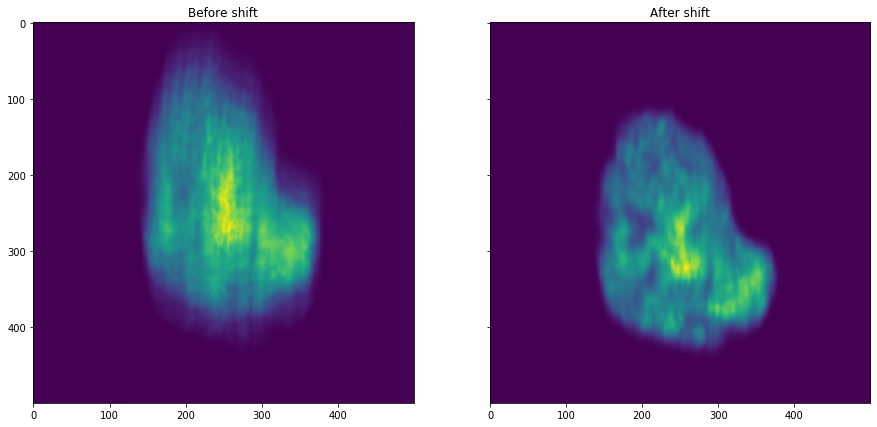
plot_comparison(dataset.zsum(), shift_dataset.zsum(), "After shift", "Before shift")
BSS#
[92]:
# Find number of components that represent 99% of the data
vals = shift_dataset.pca(return_vals=True)
vals = vals / numpy.sum(vals)
n_components = len(vals[vals > 0.01])
n_components
[92]:
3
[93]:
# Compute NNICA+NMF to find the components
comp, W = shift_dataset.nica_nmf(n_components, num_iter=500)
Updating decomposition matrices |████████████████████████████████████████████████████████████████████████████████████████████████████| 100.0%
/users/garrigaf/.local/share/virtualenvs/darfix/lib/python3.7/site-packages/sklearn/decomposition/_nmf.py:1077: ConvergenceWarning: Maximum number of iterations 500 reached. Increase it to improve convergence.
  " improve convergence." % max_iter, ConvergenceWarning)
[ ]:
fig, ax = plt.subplots(ncols=n_components, figsize=(50, 5), sharex=True, sharey=True)

# print(components.shape)
plt.suptitle("NNICA components of dataset")
for i in numpy.arange(n_components):
    ax[i].imshow(comp[i].reshape(shift_dataset.get_data(0).shape))
    ax[i].axis("off")
[ ]:
# Save components on treated folder

from darfix.io.utils import write_components

h, w = shift_dataset.get_data(0).shape
write_components(
    "components",
    "entry",
    shift_dataset.get_dimensions_values(),
    W,
    comp.reshape((n_components, h, w)),
    "1",
)
Feature Matching#
[ ]:
from darfix.core.componentsMatching import ComponentsMatching, Method
from darfix.io.utils import read_components

db1 = "components"
db2 = "components"


dimensions1, components1, W1 = read_components(db1)
dimensions2, components2, W2 = read_components(db2)

componentsMatching = ComponentsMatching(components=[components1, components2])

final_matches, matches = componentsMatching.match_components(
    method=Method.orb_feature_matching
)

draws = numpy.array(
    componentsMatching.draw_matches(final_matches, matches, displayMatches=False)
)
[ ]:
rows = 1
cols = int(len(draws) / rows)
fig, ax = plt.subplots(ncols=cols, nrows=rows, figsize=(30, 5))

# print(components.shape)
plt.suptitle("Linked components from two different layers of HEAT 1")
for i in range(cols):
    ax[i].imshow(draws[i], cmap="jet")
    ax[i].axis("off")
    if i in final_matches:
        ax[i].set_title("{}, {}".format(i, final_matches[i]))
    else:
        ax[i].set_title("{}, -".format(i))
Grain plot#
[25]:
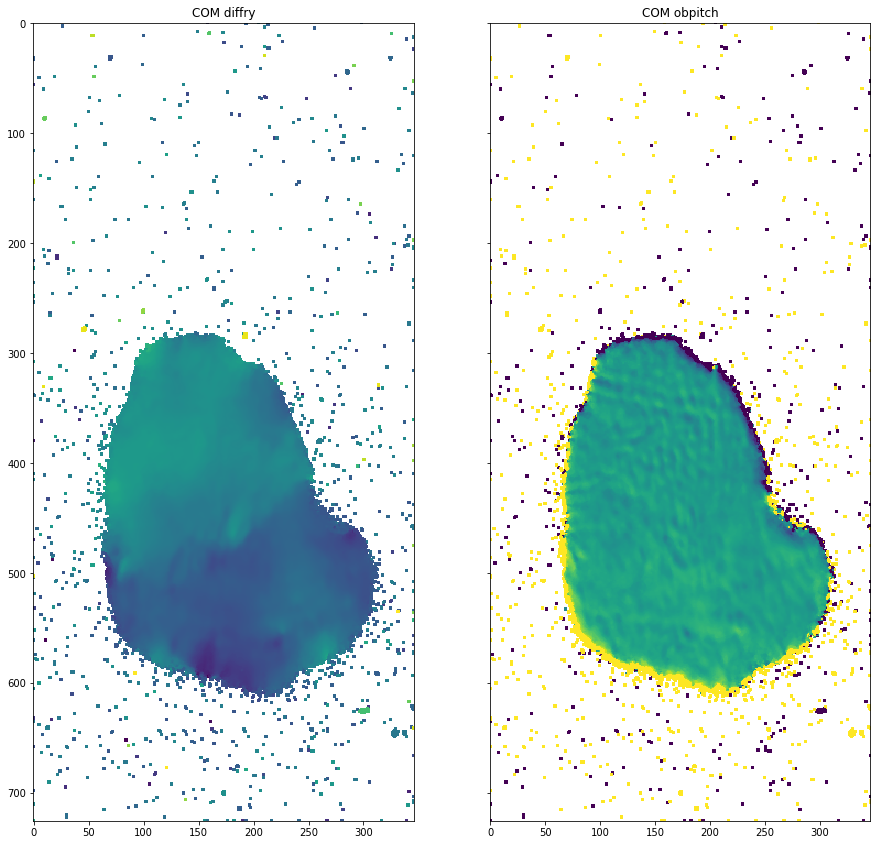
# Compute moments
moments = dataset.apply_moments()
plot_comparison(moments[0][0], moments[1][0], "COM obpitch", "COM diffry")
/users/garrigaf/Documents/git/darfix/darfix/core/mapping.py:231: RuntimeWarning: invalid value encountered in true_divide
  com = numpy.sum(stack, axis=0) / zsum
/users/garrigaf/Documents/git/darfix/darfix/core/mapping.py:234: RuntimeWarning: invalid value encountered in true_divide
  std = numpy.sqrt(sum((data[i] * ((repeat_values[i] - com)**2) for i in range(len(data))))) / zsum
[49]:
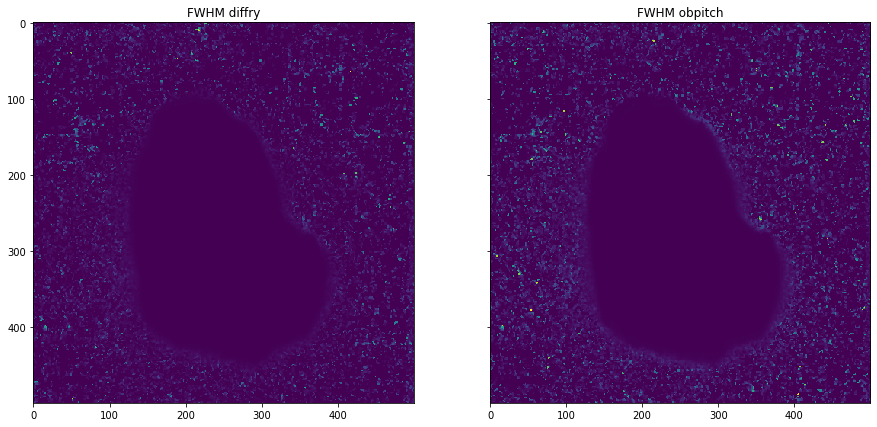
# Compute FWHM
plot_comparison(moments[0][1], moments[1][1], "FWHM obpitch", "FWHM diffry")
[50]:
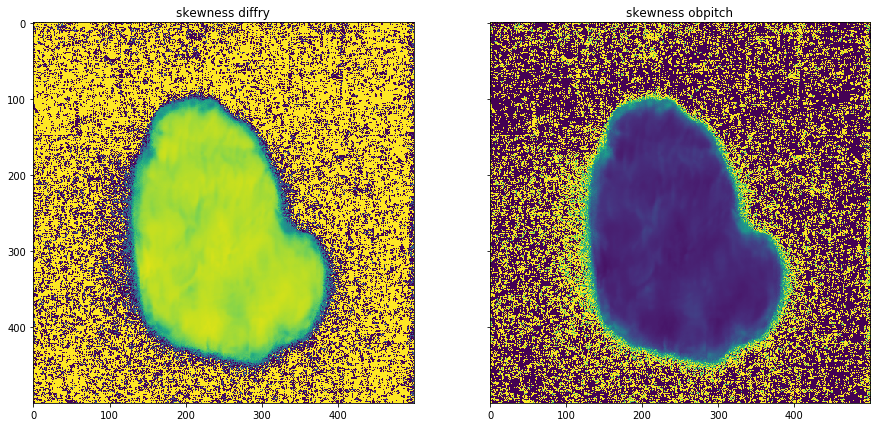
# Show skewness
plot_comparison(moments[0][2], moments[1][2], "skewness obpitch", "skewness diffry")
[51]:
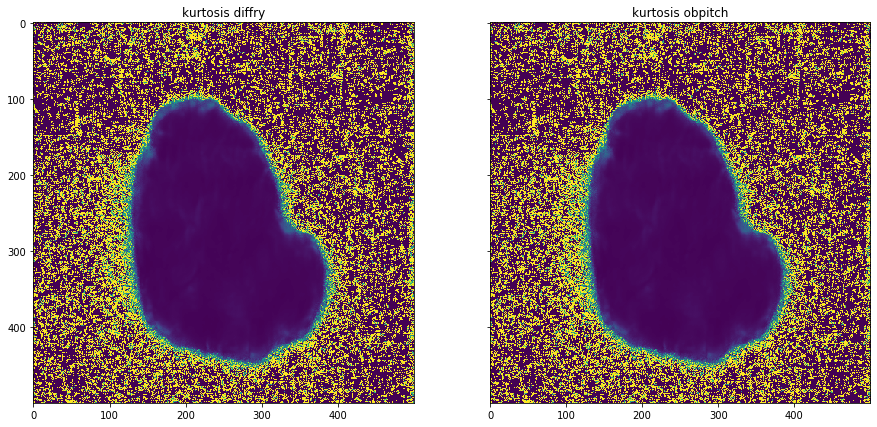
# Compute kurtosis
plot_comparison(moments[0][3], moments[1][3], "kurtosis obpitch", "kurtosis diffry")
[45]:
# Compute mosaicity
from matplotlib.colors import hsv_to_rgb

com0 = moments[0][0]
no_nans_indices = ~numpy.isnan(com0)
min_com0 = numpy.min(com0[no_nans_indices] if len(com0[no_nans_indices]) > 0 else com0)
com0[numpy.isnan(com0)] = min_com0
norms0 = (com0 - min_com0) / numpy.ptp(com0)
com1 = moments[1][0]
no_nans_indices = ~numpy.isnan(com1)
min_com1 = numpy.min(com1[no_nans_indices] if len(com1[no_nans_indices]) > 0 else com1)
com1[numpy.isnan(com1)] = min_com1
norms1 = (com1 - min_com1) / numpy.ptp(com1)

mosaicity = numpy.stack((norms0, norms1, numpy.ones(moments[0].shape[1:])), axis=2)

plt.imshow(hsv_to_rgb(mosaicity))
[45]:
<matplotlib.image.AxesImage at 0x7fd3b44e19e8>
[91]:
from matplotlib.colors import hsv_to_rgb
from silx.image.marchingsquares import find_contours

ori_dist, hsv_key = shift_dataset.compute_mosaicity_colorkey(scale=1)
plt.imshow(hsv_to_rgb(hsv_key))
levels = numpy.linspace(numpy.min(ori_dist), numpy.max(ori_dist), 15)
for i in levels:
    polygons = find_contours(ori_dist, i)
    for contour in polygons:
        x = contour[:, 1]
        y = contour[:, 0]
        centroid = (sum(x) / len(contour), sum(y) / len(contour))
        plt.plot(x, y)
        if i == levels[-2]:
            plt.plot(centroid[0], centroid[1], "ro")
plt.show()
Fit data#
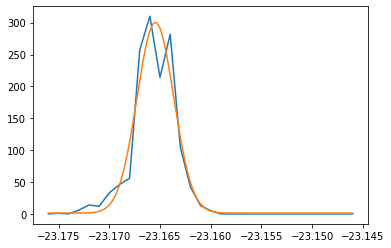
[50]:
# Show rocking curve
from darfix.core.mapping import fit_rocking_curve

px, py = 300, 374
dimension = [[1], [1]]
data = shift_dataset.get_data(dimension=dimension)

if shift_dataset.in_memory:
    y = data[:, int(py), int(px)]
else:
    y = [image[int(py), int(px)] for image in data]

axis = shift_dataset.dims.ndim - dimension[0][0] - 1
dim = shift_dataset.dims.get(axis)
x = numpy.array(
    [data.metadata[i].get_value(kind=dim.kind, name=dim.name) for i in range(len(data))]
).reshape(-1)
item = [numpy.array(y), None]

plt.plot(x, y)

try:
    y_gauss = fit_rocking_curve(item, values=x, num_points=1000)
except TypeError:
    y_gauss = y
    print("Cannot fit")

x_gauss = numpy.linspace(x[0], x[-1], len(y_gauss))
plt.plot(x_gauss, y_gauss)
[50]:
[<matplotlib.lines.Line2D at 0x7f6a027fb3c8>]
[27]:
%%capture --no-display
fit_dataset = shift_dataset.apply_fit(dimension=dimension)
[46]:
numpy.max(fit_dataset.zsum()[1])
[46]:
20.70828701296387
[47]:
numpy.max(shift_dataset.zsum()[1])
[47]:
19
[29]:
img = numpy.sqrt(numpy.subtract(fit_dataset.zsum(), shift_dataset.zsum()) ** 2)
[43]:
numpy.argmax(numpy.subtract(fit_dataset.zsum(), shift_dataset.zsum())[1])
[43]:
312
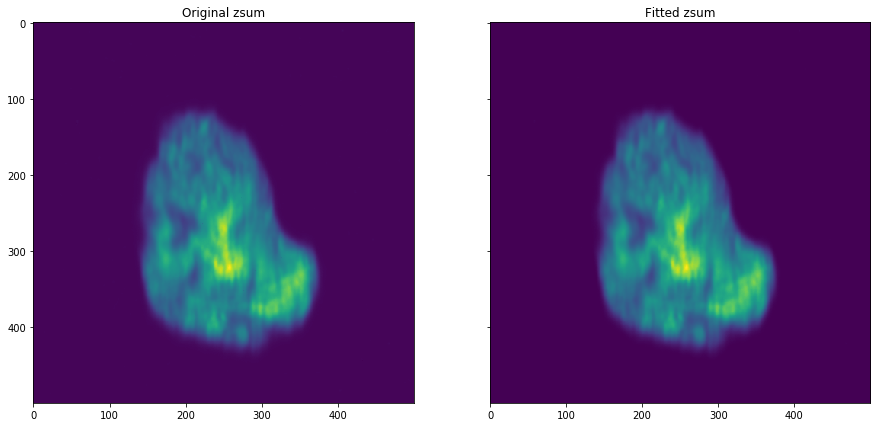
[31]:
plot_comparison(
    fit_dataset.zsum(), shift_dataset.zsum(), "Fitted zsum", "Original zsum"
)
[62]:
# Plot FWHM
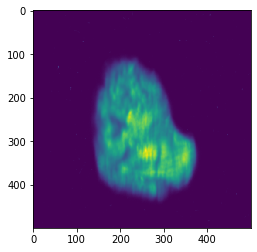
std = numpy.std(shift_dataset.get_data(), axis=0)
std[numpy.isnan(std)] = 0
plt.imshow(2.35482 * std)
[62]:
<matplotlib.image.AxesImage at 0x7fd94dd8f710>
[63]:
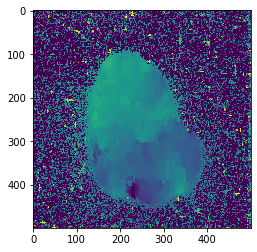
# Plot peak values depending on the dimension (motor choosen for the fit)

data = shift_dataset.get_data()
axis = dimension[0][0]
dim = shift_dataset.dims.get(0)
values = numpy.array(
    [metadata.get_value(kind=dim.kind, name=dim.name)[0] for metadata in data.metadata]
)
x = numpy.array(numpy.argmax(data, axis=0))
image = [values[i] for i in x.flatten()]
image = numpy.reshape(image, x.shape)

plt.imshow(image)
[63]:
<matplotlib.image.AxesImage at 0x7fd9a34f7390>
[ ]: